Image:Enzyme cascade.jpg
From Proteopedia
No higher resolution available.
Enzyme_cascade.jpg (789 × 560 pixel, file size: 34 KB, MIME type: image/jpeg)
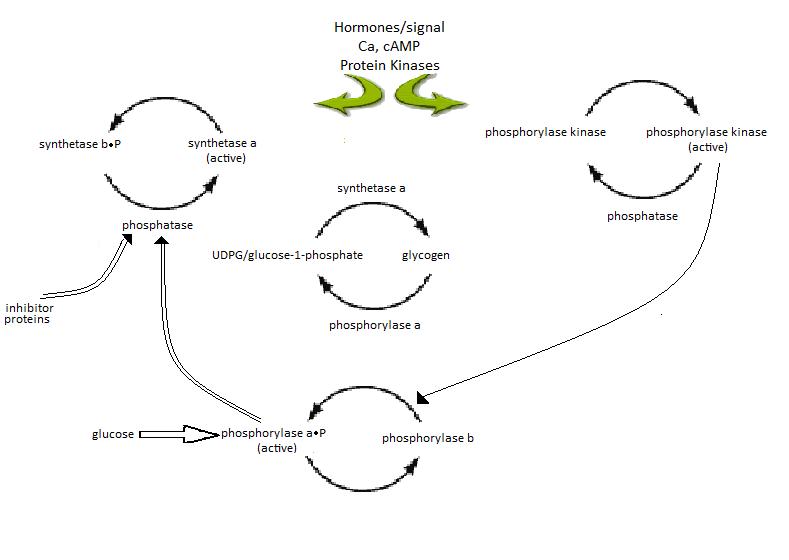
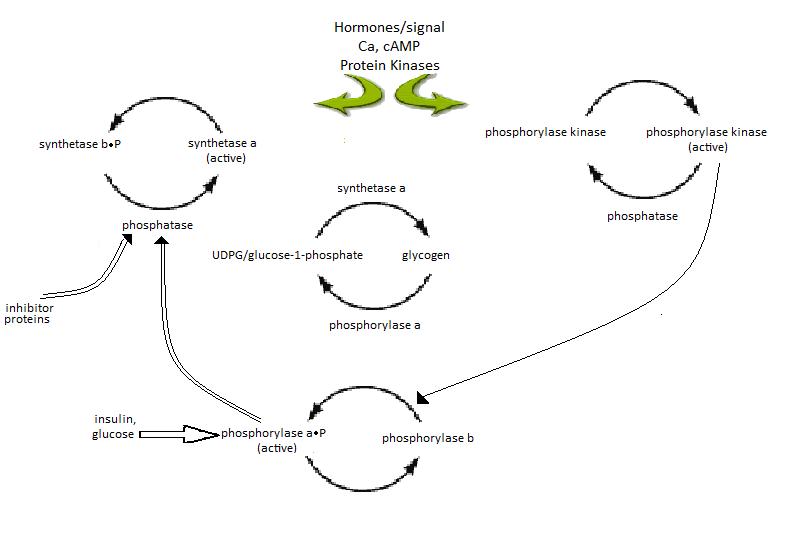
Figure 1: Diagram illustrating the enzyme cascade that occurs when hormones(and neural signals)catalyze the activation of phosphorylase through kinase activity and thus inactivating glycogen synthetase. Phosphatases inactivate phosphorylase and is regulated by phosphorylase itself as well as inhibitor proteins. High glucose concentratios also lead to the inactivation of phosphorylase (inactivation represented by open arrows). Diagram adapted from (Ref).
File history
Click on a date/time to view the file as it appeared at that time.
| Date/Time | User | Dimensions | File size | Comment | |
|---|---|---|---|---|---|
| (current) | 09:26, 30 March 2010 | Amy Chahal (Talk | contribs) | 789×560 | 34 KB | Figure 1: Diagram illustrating the enzyme cascade that occurs when hormones(and neural signals)catalyze the activation of phosphorylase through kinase activity and thus inactivating glycogen synthetase. Phosphatases inactivate phosphorylase and is regulat |
| 08:55, 30 March 2010 | Amy Chahal (Talk | contribs) | 789×560 | 34 KB | Figure 1: Diagram illustrating the enzyme cascade that occurs when hormones(and neural signals)catalyze the activation of phosphorylase through kinase activity and thus inactivating glycogen synthetase. Phosphatases inactivate phosphorylase and is regulat |
- Edit this file using an external application
See the setup instructions for more information.
Links
The following pages link to this file:
