Image:Ramachandran Gly Pro data and contours T8000 small.jpg
From Proteopedia
Size of this preview: 800 × 426 pixels
Full resolution (2520 × 1341 pixel, file size: 1.34 MB, MIME type: image/jpeg)
Summary
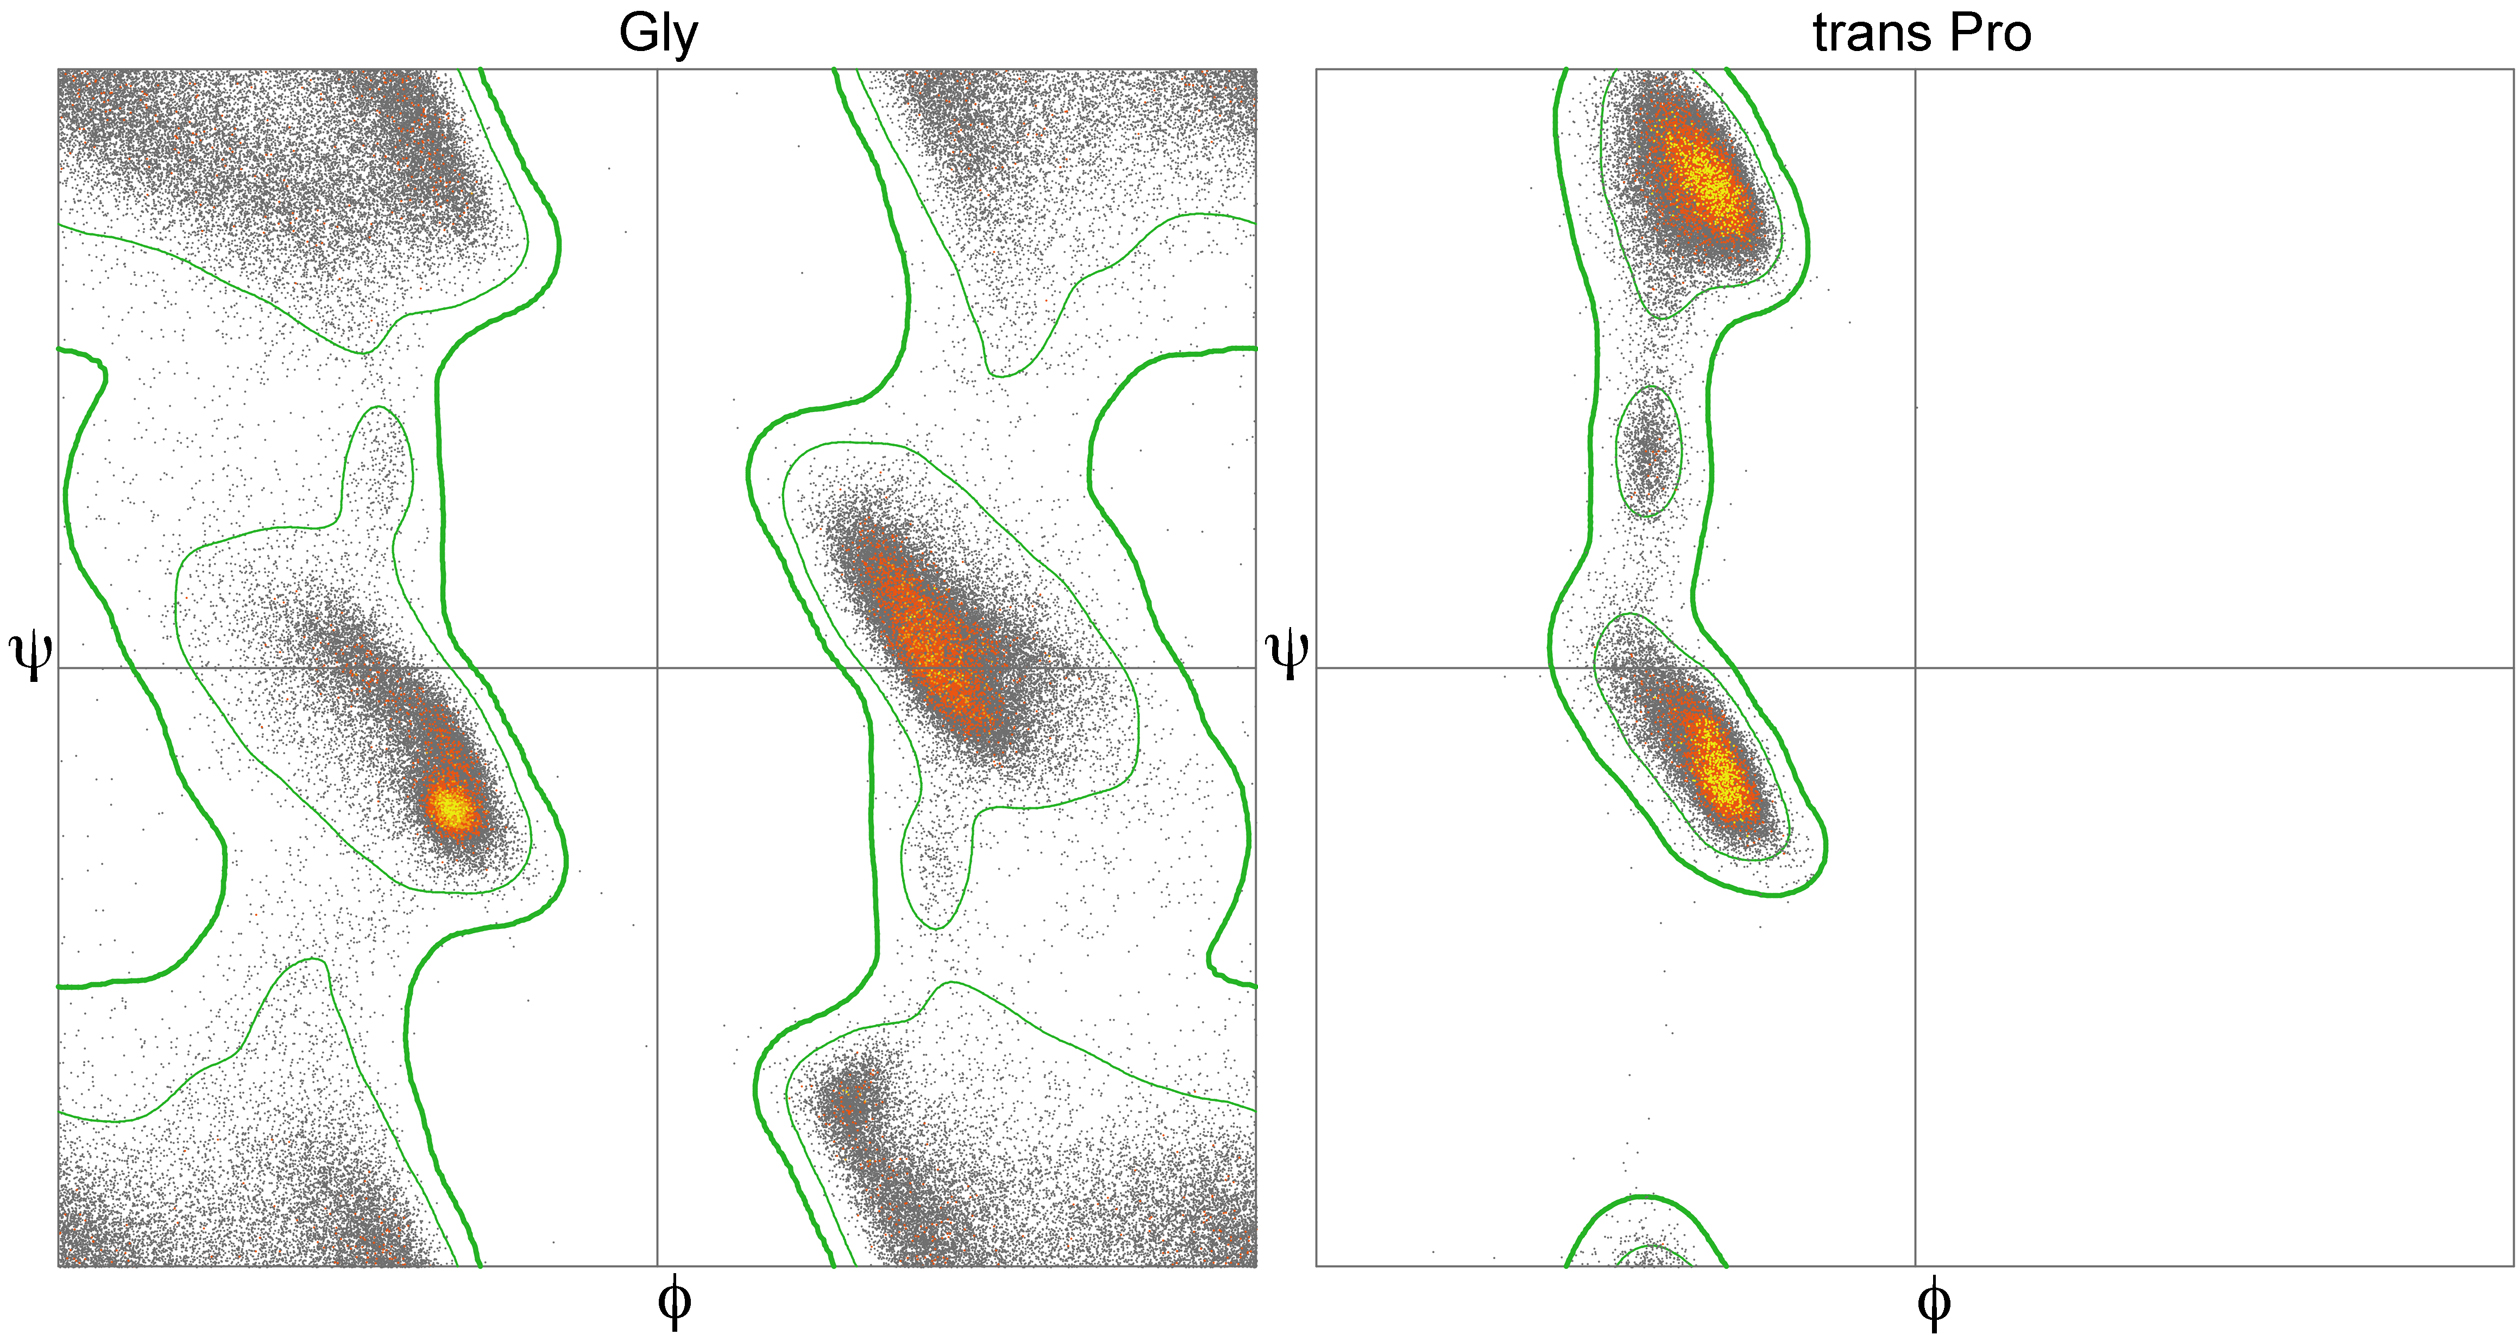
Ramachandran plots (phi, psi backbone torsion angles) for glycine (left) and for trans proline (right). Datapoints from the "Top8000" crystal-structure chains with both resolution and MolProbity score <2.0, non-redundant at the PDB's 70% clusters, and each point with backbone B-factors ≤30. Inner contour encloses 98% of this high-quality data (favored region); outer contour encloses 99.9% (allowed) and excludes 0.1% (outlier or disallowed region). Methodology from [1] and [2].
Licensing
Creative Commons Attribution 3.0 License
![]()
File history
Click on a date/time to view the file as it appeared at that time.
| Date/Time | User | Dimensions | File size | Comment | |
|---|---|---|---|---|---|
| (current) | 15:28, 8 June 2012 | Jane S. Richardson (Talk | contribs) | 2520×1341 | 1.34 MB | Ramachandran plots (phi, psi backbone torsion angles) for glycine (left) and for trans proline (right). Datapoints from the "Top8000" crystal-structure chains with both resolution and MolProbity score <2.0, non-redundant at the PDB's 70% clusters, and ea |
- Edit this file using an external application
See the setup instructions for more information.
Links
The following pages link to this file:
Metadata
This file contains additional information, probably added from the digital camera or scanner used to create or digitize it. If the file has been modified from its original state, some details may not fully reflect the modified image.
| Orientation | Normal |
|---|---|
| Horizontal resolution | 72 dpi |
| Vertical resolution | 72 dpi |
| Software used | Adobe Photoshop CS5 Macintosh |
| File change date and time | 06:32, 8 June 2012 |
| Color space | sRGB |
