4Q7Q is a protein found in Chitinophaga pinensis, a soil bacterium in the sphingobacterial family. Its structure was characterized by the 15-year Protein Structure Initiative (PSI) launched by the National Institutes of Health (NIH) and therefore exists in Protein Data Bank (PDB). Its function, however, has not.
After structural and sequential analysis via various databases including BLAST, Pfam, Dali, PyMOL, and ProMOL, we initially predicted that 4Q7Q is a hydrolase. More specifically, we hypothesized that 4Q7Q is a lipase, an enzyme that can breaks down lipids to form fatty acids and a glycerol molecule.
Characteristics of 4Q7Q
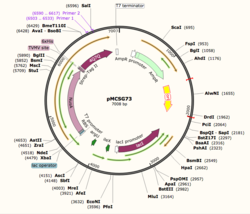
Figure 1: Plasmid Map of pMCSG73, the expression vector for 4Q7Q.
4Q7Q is composed of two chains; one chain can be seen . The colors indicate the translation direction of the peptide sequence from the N to C terminus; red represents the N-terminus while dark blue represents the C-terminus. Based on this structural model, we can see that 4Q7Q is an alpha-beta superfold; there are beta sheets (represented by the straighter strands) sandwiched between the alpha helices (represented by the coiled strands).
Using SnapGene, we analyzed the plasmid pMCSG73, which is the expression vector used to produce 4Q7Q. We found that the plasmid's open reading frame (ORF), the sequence of DNA that will be eventually translated, is 2237 base pairs in length. The size of 4Q7Q is 87.1 kDa.
Overall, as seen in Figure 1, the ORF is composed of NusA (a transcription elongation factor), two tags- 6XHis and Strep-Tag II, and a TVMV and TEV site. The plasmid map indicates the presence of a lac operon composed of three genes (lacZ, lacY, and lacA), a promoter (region that initiates transcription), terminator (region that marks the end of transcription), regulator (which codes for a repressor), and operator (repressor binds to it to prevent gene expression).
In silico Analysis
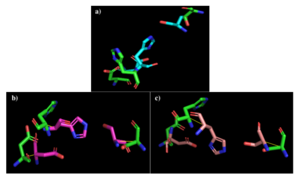
Figure 2: a) Alignment of 4Q7Q's putative catalytic triad (green) and 3LIP's catalytic triad (blue). b) Alignment of 4Q7Q's putative catalytic triad (green) and 1TAH's catalytic triad (pink). c) Alignment of 4Q7Q's putative catalytic triad (green) and 1BWR's catalytic triad (salmon).
We initially analyzed 4Q7Q through the protein structure databases BLAST, Pfam, and Dali. The top hit was 4M8K, a GDSL-like lipase, a type of a lipase that has a flexible active site and therefore broad substrate specificity. Through BLAST, we found that 4M8K and 4Q7Q had a 36% sequence identity, with an E value (a parameter that measures the number of alignments one can expect to see by chance) of 0.002, indicating that it is a significant match. Since we can use the principle of homology to predict the function of an unknown protein, we first hypothesized that 4Q7Q was too a lipase.
Through analyzing the sequence of 4Q7Q in SnapGene and then analyzing the 3D structure in PyMOL, we hypothesized that a possible catalytic triad of 4Q7Q is Ser164, Asp193, and His196. We believe that this group of amino acids are involved in the active site of 4Q7Q and therefore affects how the protein performs. As seen in this , all three amino acids are close in proximity to one another and are brought together in a single orientation.
We also performed further analysis in PyMOL and ProMOL which involved the homology of active sites. Top hits included 3LIP, a lipase found in Burkholderia cepacia (a human pathogen that can cause pneumonia), 1TAH, a lipase found in Burkholderia glumae (a soil bacterium), and 1BWR, a hydrolase found in Bos taurus (cattle). We aligned the putative catalytic triad of 4Q7Q with each of the catalytic triads of these known proteins.
3LIP has two chains. As seen in Figure 2a, when aligning the catalytic triad of 3LIP (Asp264, Ser87, His286) to the putative catalytic triad of 4Q7Q, the RMS is 2.257.
1TAH has four chains. As seen in Figure 2b, when aligning the catalytic triad of 1TAH (Asp263, Ser87, His285) to the putative catalytic triad of 4Q7Q, the RMS is 2.205.
1BWR has one chain. As seen in Figure 2c, when aligning the catalytic triad of 1BWR (Asp192, Ser47, His195) to the putative catalytic triad of 4Q7Q, the RMS is 2.049.
Compiling all of the data together, we can see that 1BWR's catalytic triad is most structurally similar to the putative catalytic triad of 4Q7Q due to the lower RMS (root mean square) value measured. Therefore, we hypothesized that 4Q7Q is most likely a hydrolase; through experiments, we can investigate further if 4Q7Q is specifically a lipase.
Bacterial Transformation and Plasmid Purification
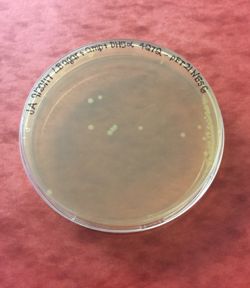
Figure 3: 4Q7Q bacterial transformation results.
Before characterizing the function of 4Q7Q, we first needed to synthesize the protein through first transcribing 4Q7Q's DNA to amplify it and then translating it to express it. First, 4Q7Q's DNA was transcribed using its expression vector, the plasmid pMCS573. Since transformation must occur within a cell, the plasmid was transformed into DH5α cells using New England Biolabs protocol.
After transformation, DH5α cells were lysed and spread on plates containing LB and ampicillin. Since 4Q7Q's plasmid is ampicillin resistant, only the bacteria that have been transformed with 4Q7Q's plasmid will grow on the plates. 4Q7Q's plasmid was then purified using Zyppy Plasmid Miniprep Kit.
However, although DH5α cells maximize the efficiency of transformations, they do not contain T7 polymerase, which is essential for protein expression. Therefore, the purified plasmid underwent another bacterial transformation into BL21 (DE3) cells that do contain T7 polymerase using New England Biolabs protocol.
Protein Expression and Measuring Plasmid Concentration
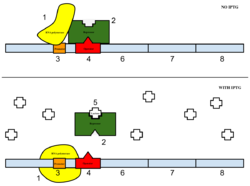
Figure 4: Top: how lac operon works in the absence of IPTG. Bottom: how lac operon works in the presence of IPTG.
After the second bacterial transformation, BL21 cells were lysed and spread on LB+amp plates. A bacterial colony was then selected from a plate and suspended in liquid culture. After incubation overnight, the OD260, or the absorbance of the sample at 260 nm, was measured with a biophotometer.
From our OD260, we calculated that our plasmid DNA concentration was 28.7 μg/ mL. This concentration is low, probably due to the large size of our ORF.
The sample was then induced with IPTG. As seen in Figure 4, IPTG is a reagent that prevents the repressor from binding to the operator to allow expression to occur.
Protein Purification
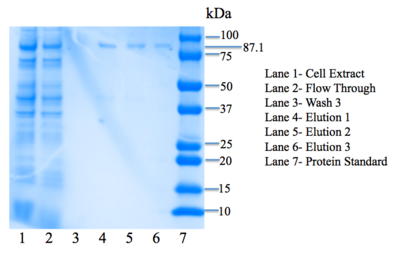
Figure 5: SDS-PAGE gel. Bands are present in elution lanes at 87.1 kDa.
4Q7Q was then purified using the HisPUR Ni-NTA Purification kit. A nickel column as well as equilibration, wash, and elution buffers were used. We then tested for expression using SDS-PAGE, an electrophoresis method that separates proteins by mass in a polyacrylamide gel. BioRad's mini protean tetra protocol was utilized for SDS-PAGE.
Lanes in our gel contain samples of the cell extract, flow through, the third wash step, as well as all three elutions. We want to see everything– our protein and all extra nucleic acids– in the cell extract lane. In the flow-through lane, we do not want to see the protein being expressed. In the wash lanes, we want to be able to see a little bit of the protein as the buffer removes more and more unwanted nucleic acids. We are most interested in seeing our protein eluted in the three elution lanes. As seen in Figure 5, there are faint bands in the three elution lanes corresponding to our protein's weight: 87.1 kDa, confirming that we have successfully expressed 4Q7Q at a low concentration.
Measuring Protein Concentration
We measured the absorbance of a purified 4Q7Q sample (not used in the gel) at 280 nm in a spectrometer. We found that the A280 is 0.886.
In order to calculate the concentration of 4Q7Q, we had to use Beer's Law, shown in figure 6. Using SnapGene, we found that ε for 4Q7Q was 45840 M-1cm-1. The cuvette in our spectrometer was 1 cm in width, therefore path length was also 1 cm.
Through plugging in these values, we found that the concentration of our purified protein is 19.3μM.
pNPB Lipase Activity Assay
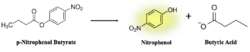
Figure 7: pNPB assay reaction. Nitrophenol is yellow.
We performed a lipase activity assay using p-nitrophenyl butyrate. We added pNPB to 4Q7Q in an aqueous solution consisting of two solutions. One contained 50 mM Tris buffer and Triton-X, while the other contained pNPB dissolved in n-heptane.
Given the low concentration of our protein expressed during SDS-PAGE analysis, we employed a 10:1 ratio between the enzyme, 4Q7Q, and the substrate, pNPB. Through increasing the ratio, we hoped that we would be able to observe 4Q7Q's enzymatic activity in a shorter period of time, given our time constraints in the lab. Molarities of 0.15 and 0.5 were tested for pNPB.
A spectrophotometer was employed to measure the A430 over a 10 minute period.
As seen in figure 7, a lipase breaks down pNPB into nitrophenol and butyric acid. Nitrophenol is yellow, therefore a color change can be detected. The spectrophotometer quantitatively measures the absorbance of the sample over time; we expect an increasing rate of nitrophenol production over time. When pNPB runs out, the rate should flatten out, as there will be no more reactants to turn into products.
We then plotted the data of A430 vs. time in seconds. We can see that nitrophenol was being produced at an increasing rate and therefore conclude that 4Q7Q acts like a lipase.
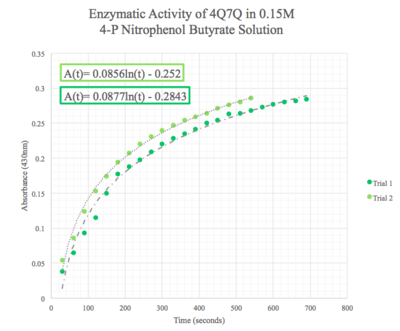
Figure 8: Enzymatic activity of 4Q7Q in 0.15 M pNPB. The ratio of 4Q7Q to pNPB is 10:1.
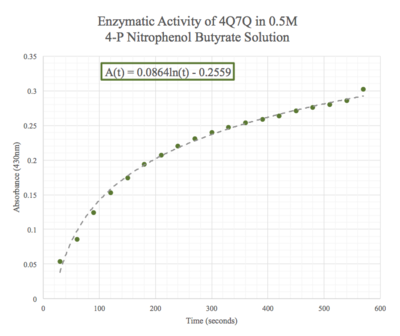
Figure 9: Enzymatic activity of 4Q7Q in 0.5 M pNPB. The ratio of 4Q7Q to pNPB is 10:1.
Site-Directed Mutagenesis
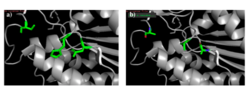
Figure 10: a) Putative catalytic triad of 4Q7Q: Ser164, Asp193, His196. b) S164A, D193A, H196A mutagenesis.
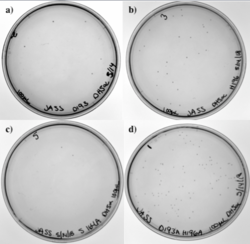
Figure 11: a) D193A mutation. b) H196A mutation. c) S164A mutation. d) D193A and H196A mutations.
To test our hypothesized catalytic triad, we performed site-directed mutagenesis using PCR on 4Q7Q with specialized primers. After mutating the suspected catalytic triad, transforming the mutated plasmid DNA, and purifying the plasmid, we sent our DNA out for sequencing to confirm that our mutagenesis was successful. After another round of protein expression and purification, we then planned to perform a pNPB assay. Through mutating the catalytic triad, we expect that the protein will no longer be able to perform as a lipase; it will not cleave pNPB to form butyric acid and nitrophenol.
Since the methyl side chain of alanine is nonreactive and cannot be phosphorylated, we decided to mutate all three amino acids in our putative catalytic triad to alanine (S164A, D193A, H196A). In addition, alanine is hydrophobic while serine, aspartate, and histidine are hydrophilic.
Figure 13 shows our transformation results in DH5α with four of our different PCR products. Our four primers included the D193A mutation, the H196A mutation, and the S164A mutation. Since two of our primers overlapped, we also had a single primer that took care of the two mutations, D193A and H196A, simultaneously. Each plate has colonies; low transformation efficiency was expected because our cloned PCR products were lower in concentration.
Future Directions
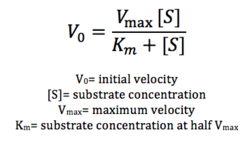
Figure 12: Michaelis-Menten equation. Calculates the maximal rate of the reaction. K
m is a measure of the concentration of the substrate when the velocity of the reaction is 1/2 V
max. A lower K
m value represents a stronger binding affinity; the reaction will reach V
max faster.
Due to time constraints, we were unable to perform another pNPB assay using the mutated catalytic triad to confirm that our putative catalytic triad was accurate.
Future directions include testing substrate specificity through using different types of lipids. Furthermore, we can attempt to optimize our enzymatic activity through varying pH, temperature, and other conditions. More assays using different concentrations of lipid are necessary to calculate Vmax according to the Michaelis-Menten equation seen in figure 12. We can also attempt to optimize our protein expression altogether, through varying concentrations of IPTG, since the concentration of our protein was low.


