User:Jennifer Taylor/Sandbox 6
From Proteopedia
Contents |
Overview

Background
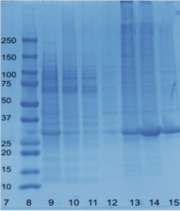
Proteins are one of four major macromolecules in biology. Present in nearly every living organism, proteins have a diverse set of functions ranging from regulating cell activity to catalyze reactions. Due to the sheer number of proteins in existence, there still remain many to discover and characterize. In 2000, the Protein Structure Initiative began an attempt to solve 3D-structures of proteins with known sequences in order to understand their functions. Though the initiative was successful, they faced financial drawbacks in 2015. There still remain several protein structures with unknown functions in a public database called the Protein Data Bank. In a final PSI summary published in 2017, 6920 structures had been solved in their seventeen years of work. What we tried to do is take one of the protein structures solved by the PSI and characterize its function.
| |||||||||||
Structural Analysis
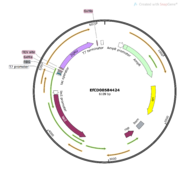
Figure 2 shows what my protein looks like inside a plasmid. We used SnapGene to figure out the weight of our protein 33.8 kda. Once we proved that we could produce our protein, we started to think about how we wanted to characterize its functions. Since we know that function and structure go hand in hand, we also used a program called PyMol to first look at the 3D structure of our protein. Here is a visualization of my protein highlighting the It’s an alpha/beta hydrolase that has one chain. It's 816 base pairs long. Then, using Dali and pFam, we ran a search for other proteins that were structurally similar to ours. We found a few hits including 1TAH and 1C4X that are classified as esterases by aligning the active sites of these proteins to ours. The left most photo in Figure 3 shows the alignment of the active sites of 2QRU and 1TAH in PyMol. The RMS values of 1TAH’s catalytic triads compared to 2QRU’s catalytic triad was much lower than the RMS value of the full length alignment so this alignment is a better representation of the structural similarity. The middle photo showss the alignment between 2QRU and1C4X in PyMol. The RMS values of 1C4X’s catalytic triads compared to 2QRU’s catalytic triad was much lower than the RMS value of the full length alignment so this alignment is a better representation of the struc- tural similarity. The right most photo shows the alignment of 2QRU and 3FAK structures in PyMol.The RMS of 3FAK and 2QRU’s active site was much higher than the full structure alignment RMS, so this alignment is a better representation of the structural similarity.Assays
In order to determine if our protein was an esterase, we used an assay found in a published paper that sought to characterize 3FAK as an esterase. They performed a colorimetric assay which we modified for our study. The study we researched used p-nitrophenyl butyrate to test if 3FAK was an esterase. When the protein came into contact with this liquid, the entire solution turned yellow. We made a blank cuvette with Tris buffer and p-nitrophenyl butyrate. Then we added our protein and measured how the color of the solution changed over 30 sec intervals for 2 min. We repeated this using various concentrations of protein.
Results
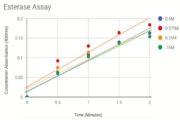
Figure 4 shows the results of the successful Esterase Assay with varied concentrations of NPB dissolved in n-Heptane. The change in colorimeter absorbance over time is shown. We graphed the OD readings for each concentration and found that 0.375M of 2QRU produced the highest rate of reaction with p-nitrophenyl butyrate. We can first conclude that our protein is an esterase, but our results were slightly confusing. We expected that the highest concentration of PNB tested, 0.5M, would have the fastest reaction rate. However, we since the second highest concentration produced the highest reaction rate, we thought perhaps 0.375M could be the optimal concentration.Possible errors include inconsistent timing when inserting the induced cuvette into the colorimeter. This may explain why 0.375M of p-nitrophenyl butyrate had the steepest reaction rate with 2QRU even though we ran tests with higher concentrations of p-nitrophenyl butyrate. P-nitrophenyl butyrate concentrations below 0.15M failed to produce a measurable reaction with 2QRU. Thus, we tried the assay again with higher concentrations of p-nitrophenyl butyrate. Another error occurred at the beginning of our research to prove that 2QRU is an esterase. Another error occurred we performed an enzymatic assay of an esterase from Sigma Aldrich that tracked the enzymatic reaction by measuring the pH change over time. After attempting the assay, there were no results and therefore we could not characterize 2QRU. This lead us to our successful assay.
Future Directions
After coming to the conclusion that 2QRU is an esterase, our next research activity would be to test if 2QRU is also a lipase. Three students from The Pingry School in New Jersey per- formed a lipase assay with 2QRU using nitrophenyl palmitate rather than p-nitrophenyl butyrate to determine if 2QRU is a lipase. Nitrophenyl palmitate has (CH2)14 side chain than nitrophenyl butyrate, so the protein has to act on a bigger substrate. If this assay works for us, then would be able to conclude that 2QRU is also a lipase. Another avenue to explore after con rming 2QRU is a lipase is mutagenesis. If we mutated the catalytic triad responsible for the reaction with nitrophenyl palmitate and ran the lipase assay again, we should see no reaction occur in the cuvette. We can use this to con rm that 2QRU is a lipase. The same thing can be done to confirm 2QRU is an esterase if we run the esterase assay using p-nitrophenyl butyrate.
References
[1]Alberts, Bruce. Molecular Biology of the Cell. 6th ed. New York, NY: Garland Science, Taylor and Francis Group, 2015. [2] Altschul, S.F., Gish, W., Miller, W., Myers, E.W. & Lipman, D.J. (1990) “Basic local alignment search tool.” J. Mol. Biol. 215:403-410. PubMed. [3] “Enzymatic Assay of an Esterase.” Sigma-Aldrich. Accessed April 27, 2018. https://www.sigmaaldrich.com/technical-documents/protocols/biology/enzy- matic-assay-of-esterase.html. [4] Lisa Holm; Laura M. Laakso (2016) Dali server update. Nucleic acids research 44 (W1), W351-W355. PDF [5]“Milestones Tables.” PSI Structural Biology Knowledgebase. Accessed April 27, 2018. http://targetdb.pdb.org/Metrics/MilestonesTables.html. [6] Nam, Ki Hyun, Min-Young Kim, Soo-Jin Kim, Amit Pryadarshi, Won Ho Lee, and KwangYeon Hwang. “Structural and Functional Analysis of a Novel EstE5 Belonging to the Subfamily of Hormone-Sensitive Lipase.” Elsevier, December 29, 2008. https://www.ncbi.nlm.nih.gov/pubmed/19116143. [7] PDB: 2QRU Cuff, M.E., Volkart, L., Moy, S., Joachimiak, A.Structure of an alpha/beta hydrolase superfamily protein from Enterococcus faecalis. [8] ProMol Project. Dr. Paul Craig, Dr. Herbert Bernstein, Dr. Jeff Mills at Rochester Institute of Technology. [9] SnapGene Software (from GSL Biotech; available at snapgene.com). [10] The Pfam protein families database: towards a more sustainable future: R.D. Finn, P. Coggill, R.Y. Eberhardt, S.R. Eddy, J. Mistry, A.L. Mitchell, S.C. Potter, M. Punta, M. Qureshi, A. Sangrador-Vegas, G.A. Salazar, J. Tate, A. BatemanNucleic Acids Research (2016) Database Issue 44:D279-D285 [11] The PyMOL Molecular Graphics System, Version 2.0 Schrödinger, LLC. [12] Zhong, Qixin and Charles E. Glatz. “Enzymatic Assay Method for Evaluating the Lipase Activity in Complex Extracts from Transgenic Corn Seed.” Journal of Agricultural and Food Chemistry. 2006(54): 3181-3185. https://lib.dr.iastate.edu/cgi/view- content.cgi?referer=&httpsredir=1&article=1075&context=cbe_pubs. [13] Messaoudi, Abdelmonem & Belguith, Hatem & Gram, Imen & Ben Hamida, Jeannette. (2010). Classi cation of EC 3.1.1.3 bacterial true lipases using phyloge- netic analysis. African Journal of Biotechnology. 9. 8243-8247. 10.5897/AJB10.721.


