File:Enolase kinetics.jpeg
From Proteopedia
Size of this preview: 474 × 599 pixels. Other resolution: 491 × 621 pixels.
Original file (491 × 621 pixels, file size: 19 KB, MIME type: image/jpeg)
Proteopedia Page Contributors and Editors (what is this?)
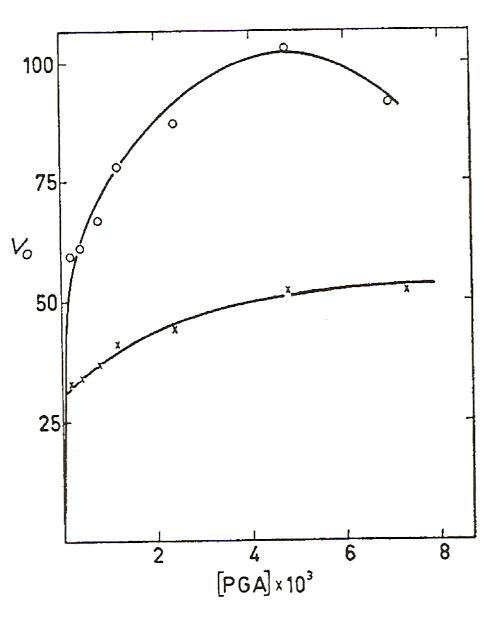
Shows the V vs. [S] graph of enolase with two different concentrations of Mg2+. The substrate, PGA, is actually 2-PG. The upper curve has an Mg2+ concentration of 10^-3 M and the lower curve has an Mg2+ concentration of 10^-2 M.
Proteopedia Page Contributors and Editors (what is this?)
File history
Click on a date/time to view the file as it appeared at that time.
| Date/Time | Thumbnail | Dimensions | User | Comment | |
|---|---|---|---|---|---|
| current | 21:11, 23 March 2010 | | 491 × 621 (19 KB) | Cory Tiedeman (talk | contribs) | Shows the V vs. [S] graph of enolase with two different concentrations of Mg2+. The substrate, PGA, is actually 2-PG. The upper curve has an Mg2+ concentration of 10^-3 M and the lower curve has an Mg2+ concentration of 10^-2 M. |
You cannot overwrite this file.
File usage
The following 3 pages use this file:


