Cavity programs
From Proteopedia
This page lists programs that identify and offer visualization options for cavities in macromolecules. Broadly, the term "cavities" includes pockets, tunnels and channels.
- An entrance is an opening from the cavity to solvent at the surface of the macromolecule.
- A pocket is a depression in the surface with one entrance.
- A tunnel connects two or more locations, and may or may not have entrances from the surface[1][2][3].
- A channel connects two entrances[3].
- A pore may mean a trans-membrane channel through an integral membrane protein[4]
- Some cavities are buried with no entrances (example: 3drf). These buried cavities are sometimes called voids[4][5][6].
Nearly all proteins have irregular surfaces with shallow pockets, mostly with no known functions. Some proteins have deep pockets, for example the catalytic anionic gorge in acetylcholinesterase (e. g. 1vot). Such a deep pocket can also be termed a tunnel accessing a functional or catalytic site[1][2].
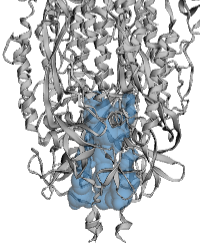
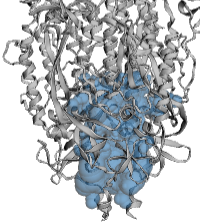
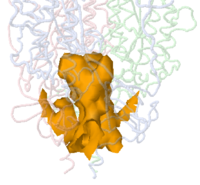
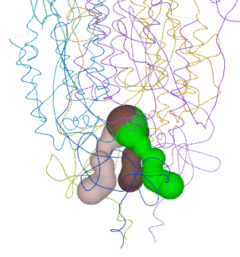
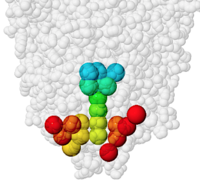
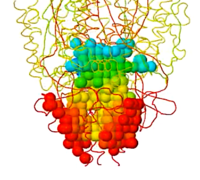
The example illustrated below is the membrane-proximal cavity of SARS-CoV-2 spike protein (6zgi). The membrane-proximal cavity is a potential target for drugs to prevent membrane fusion, and thus prevent infection.
Cavities vs. Channels
|
The programs listed alphabetically below can be categorized as follows. I. CavitiesThese programs identify any cavities between atoms of the macromolecule, or pockets beneath a smoothed macromolecular surface, that are larger than the probe diameter. No starting position need be specified. II. Channels/TunnelsThese programs require that one or more starting locations be specified. Thus, they may not identify cavities unrelated to the specified starting point(s). They look for channels/tunnels connecting a starting point with the surface, or with a specified end point.
III. Other
|
AVP
AVP (Another Void Program): "Voids are defined as holes in the protein that are not accessible to solvent, but into which a molecule of a given radius (such as a water) can fit. ... Initially a course grid is used (default 1A), but close to the protein a finer grid (default 0.1A) is used and off-grid locations are explored." In addition to locating voids, the program assesses packing quality.
(To be continued ...)
CASTp
|
CASTp:
|
CASTp: Computed Atlas of Surface Topography of proteins. "CASTp is based on recent theorectical and algorithmic results of Computational Geometry. It has many advantages: 1) pockets and cavities are identified analytically, 2) the boundary between the bulk solvent and the pocket is defined precisely, 3) all calculated parameters are rotationally invariant, and do not involve discretization and they make no use of dot surface or grid points." (See Comparison Note[7].) Shallow pockets (no cross section exceeds the mouth diameter) are not shown. No starting position is required. The probe radius (default 1.4 Å) is adjustable.
Displays protein sequences indicating which residues line the displayed cavities. Clicking on a residue centers the 3D view accordingly.
Web server visualization is in 3Dmol.js, which seems to offer no user-customizable options beyond rotate and zoom, such as centering or hiding the protein cartoon.
CASTp 3.0 published summer, 2018[8]. Available as a web server, and a PyMOL plugin. Results can be downloaded for offline viewing with the PyMOL plugin.
CAVER
CAVER is "for analysis and visualization of tunnels and channels in protein structures. Tunnels are void pathways leading from a cavity buried in a protein core to the surrounding solvent. Unlike tunnels, channels lead through the protein structure and their both endings are opened to the surrounding solvent." It "enables the analysis of molecular dynamics simulations."
CAVER is available as a Java command line program, a PyMOL plugin, and CAVER Analyst.
Personal experience: caver.jar: Although I use Jmol.jar frequently in macOS 10.14 Mojave (currently with Java 1.8.0_271), I was unable to get caver.jar to start. There is much documentation but nothing specific about macOS. caver_analyst2: I was unable to get this program to start in macOS or Windows 10. An email request for assistence sent to caver (at) caver.cz received no reply. Eric Martz 18:03, 18 December 2020 (UTC)
CAVER Web
CAVER Web, published in 2019[3], provides web access to CAVER with a straightforward user interface. A starting point must be specified. CAVER attempts to make this easy for enzymes, using the catalytic residues. For non-enzymes, it is best if the user selects some amino acids (easily done from a sequence listing, although the numbering in the left column was wrong for 6zgi). As they are selected, their average position (the starting point) is displayed in JSmol.
Personal experience: After selecting Asn907 in all 3 chains of 6zgi (these encircle the deepest part of the membrane-proximal cavity), and after >10 min of processing, after processing finished, was unable to display the results due to "Proxy Error - error reading from remote server". Same result for a different job. Same result in Chrome and Firefox. Eric Martz 20:08, 18 December 2020 (UTC)
ChExVis
|
ChExVis: |
ChExVis: Channel Extraction and Visualization[9].
Problem in December, 2020: Specifying a PDB ID always fails with "Failed to connect to RSCB site. The specified PDB-ID not found on RCSB database. Check PDB-ID or upload the PDB file yourself." But it works if you upload the PDB file.
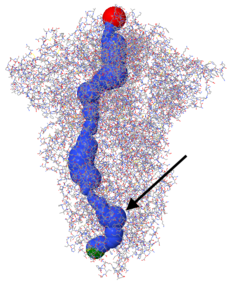
Limited to channels with two entrances. Can display only one channel at a time. Channels are represented as overlapping spheres, thus radially symmetric. Offers a channel profile graph showing channel diameter that can be colored by many different properties. A list of channel-lining atoms is provided (not spreadsheet-ready), and these can be displayed as yellow atoms on the blue channel.
Personal experience: For SARS-CoV-2 spike protein 6zgi, I specified a User Defined Site as 3 residues that encircle the deepest part of the membrane-proximal cavity (Asn 907 in all 3 chains of the homotrimer). The result was 45 channels that passed through this site. Visualization is in JSmol but the macromolecule rendering options are limited as all obscure the channel. It would be useful to have a thin backbone trace that would less obscure the channel, or to provide translucency e.g. for cartoon. Also, translucency for the channel, which would enable seeing any ligands within, is not offered. Eric Martz 21:33, 18 December 2020 (UTC)
Jmol
|
Jmol:
(Both used the default macromolecular surface smoothing probe radius of 10 Å.) |
Jmol can identify and display pockets and cavities as isosurfaces. Examples are shown at Jmol/Cavities pockets and tunnels, where you will also find explanations of the interior cavity and pocket commands. Cavities are identified as spaces between macromolecule atoms large enough to accomodate a cavity probe (default cavity probe radius 1.2 Å, configurable), or pockets between a smoothed macromolecular surface (default surface probe radius 10 Å, configurable) and atoms of the macromolecule. Starting point(s) are not relevant. Pockets are depicted with open mouths (illustrated here: pink, orange, yellow, blue); Interior Cavities (buried cavities; voids) are depicted as closed isosurfaces (illustrated here: green).
Jmol has an extensive command language that provides great flexibility in visualizing cavities. However, displaying more than one isosurface fragment at a time, and coloring the fragments differently (as in the left snapshot) is cumbersome.
The Jmol Java standalone application is downloadable from jmol.org. It is also available as JSmol, a Javascript implementation used in most pages in Proteopedia.
Jmol is updated often. In December, 2020, the most recent update was November 19, 2020.
MAP_CHANNELS
MAP_CHANNELS offers identification and visualization of solvent channels in macromolecular crystals[10].
MolAxis
MolAxis[11] for identification of channels in macromolecules.
Personal experience: Server appears to be out of order. Three jobs submitted in December, 2020, with PDB IDs or an uploaded PDB file, all immediately reported "An unexpected error occured in your MolAxis run. Please check your input molecule and parameters.". An email inquiry to Eitan Yaffe received no reply. Eric Martz 21:45, 18 December 2020 (UTC)
MOLEonline
|
MOLEonline: |
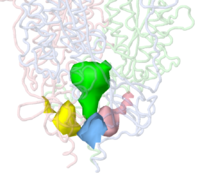
MOLEonline[4] locates and characterizes channels, tunnels and pores. Best results are obtained when starting points are specified, which can be obtained from the Catalytic Site Atlas (CSA). Channels are represented as chains of overlapping spheres, thus radially symmetric. Visualization is in LiteMol, which has many menu options for rendering, but does not offer transparency. The thin "C-α trace" is the least obscuring. One can specify starting points and end points by selections (clickable sequence listing), residue lists, or XYZ points. Any subset of detected cavities can be displayed via checkboxes. After a cavity has been selected by clicking in the 3D rendering: Lining residues are listed (not spreadsheet ready); Properties are listed such as bottleneck (radius?) and length (but not area nor volume); a graphic is displayed showing selected properties (hydropathy, hydrophobicity, charge, polarity, etc.) along the length of the channel.
Results can be downloaded in many formats, including for PyMOL, VMD, and Chimera. When PDB format is downloaded, a channel is represented by atoms of element 'X', group 'TUN', with sequence number = tunnel ID.
Personal experience: When SARS-CoV-2 spike protein 6zgi was submitted, cavities (connecting to the surface) and voids were displayed automatically. None represented the membrane-proximal cavity. When the center of the deepest part of the membrane-proximal cavity was specified via XYZ (215.6, 215.6, 157.6), tunnels were detected, including the three pictured at right. This was with the default Cavity parameter: probe radius of 5 Å. No tunnels were detected with that parameter set to 1.4 or 2.0 Å.
PACUPP
|
PACUPP:
|
|
Inhibitor and 3 water oxygens inside cavity. |
Cavity measurements. |
|
Catalytic pocket of acetylcholinesterase 1vot containing the inhibitor huperzine A. Colored by depth from the surface entrance. Cavity detail: extra fine. See how to obtain these views in PACUPP. | |
PACUPP], Pockets And Cavities Using Pseudoatoms in Proteins, identifies cavities by filling them with pseudoatoms (holmium, Ho, think "holes"; see comparison note[7]). Cavities are identified as spaces between macromolecule atoms large enough to accomodate a cavity probe (default cavity probe radius 1.5 Å, configurable), or pockets between a smoothed macromolecular surface (default surface probe radius 10 Å, configurable) and atoms of the macromolecule. Starting point(s) are not relevant. An example is presented in some detail at PACUPP: Pockets And Cavities Using Pseudoatoms in Proteins. Further examples with demonstrations of how to use PACUPP are in a YouTube video and a slideshow, available from molviz.org/pacupp, where you can also download the program.
PACUPP offers a number of simple commands specialized for visualizing cavities, mostly single letter commands. Some call up a dialog where the use enters information. Lists cavity-lining atoms in a spreadsheet-ready text file. Learning the PACUPP commands is much easier than learning Jmol commands.
PACUPP is a Jmol script. It processes 2/3 of the entries in the Protein Data Bank in ≤15 sec each. For large models such as ribosomes or proteasomes that may take many minutes, PACUPP offers an unattended batch mode.
First released December, 2020.
See Also
- Jmol/Cavities pockets and tunnels
- PACUPP: Pockets And Cavities Using Pseudoatoms in Proteins
- Jmol/Depth from surface
- SARS-CoV-2 spike protein fusion transformation which discusses the spike protein cavity used as an example above.
References
- ↑ 1.0 1.1 Marques SM, Daniel L, Buryska T, Prokop Z, Brezovsky J, Damborsky J. Enzyme Tunnels and Gates As Relevant Targets in Drug Design. Med Res Rev. 2017 Sep;37(5):1095-1139. doi: 10.1002/med.21430. Epub 2016 Dec 13. PMID:27957758 doi:http://dx.doi.org/10.1002/med.21430
- ↑ 2.0 2.1 Kingsley LJ, Lill MA. Substrate tunnels in enzymes: structure-function relationships and computational methodology. Proteins. 2015 Apr;83(4):599-611. doi: 10.1002/prot.24772. Epub 2015 Feb 28. PMID:25663659 doi:http://dx.doi.org/10.1002/prot.24772
- ↑ 3.0 3.1 3.2 Stourac J, Vavra O, Kokkonen P, Filipovic J, Pinto G, Brezovsky J, Damborsky J, Bednar D. Caver Web 1.0: identification of tunnels and channels in proteins and analysis of ligand transport. Nucleic Acids Res. 2019 Jul 2;47(W1):W414-W422. doi: 10.1093/nar/gkz378. PMID:31114897 doi:http://dx.doi.org/10.1093/nar/gkz378
- ↑ 4.0 4.1 4.2 Pravda L, Sehnal D, Tousek D, Navratilova V, Bazgier V, Berka K, Svobodova Varekova R, Koca J, Otyepka M. MOLEonline: a web-based tool for analyzing channels, tunnels and pores (2018 update). Nucleic Acids Res. 2018 Jul 2;46(W1):W368-W373. doi: 10.1093/nar/gky309. PMID:29718451 doi:http://dx.doi.org/10.1093/nar/gky309
- ↑ The CASTp server uses the term void.
- ↑ The term void is used for the program AVP (Another Void Program) from the group of Andrew C. R. Martin at University College, London UK.
- ↑ 7.0 7.1 In contrast with CASTP, PACUPP uses grid points. Therefore, its cavity boundaries are slightly different when the grid points are offset by half of the spacing between points -- an option it offers. See Offset: Hit or Miss & Cavity Volume in How To Use PACUPP.
- ↑ Tian W, Chen C, Lei X, Zhao J, Liang J. CASTp 3.0: computed atlas of surface topography of proteins. Nucleic Acids Res. 2018 Jul 2;46(W1):W363-W367. doi: 10.1093/nar/gky473. PMID:29860391 doi:http://dx.doi.org/10.1093/nar/gky473
- ↑ Masood TB, Sandhya S, Chandra N, Natarajan V. CHEXVIS: a tool for molecular channel extraction and visualization. BMC Bioinformatics. 2015 Apr 16;16:119. doi: 10.1186/s12859-015-0545-9. PMID:25888118 doi:http://dx.doi.org/10.1186/s12859-015-0545-9
- ↑ Juers DH, Ruffin J. MAP_CHANNELS: a computation tool to aid in the visualization and characterization of solvent channels in macromolecular crystals. J Appl Crystallogr. 2014 Nov 28;47(Pt 6):2105-2108. doi:, 10.1107/S160057671402281X. eCollection 2014 Dec 1. PMID:25484846 doi:http://dx.doi.org/10.1107/S160057671402281X
- ↑ Yaffe E, Fishelovitch D, Wolfson HJ, Halperin D, Nussinov R. MolAxis: a server for identification of channels in macromolecules. Nucleic Acids Res. 2008 Jul 1;36(Web Server issue):W210-5. doi:, 10.1093/nar/gkn223. Epub 2008 Apr 29. PMID:18448468 doi:http://dx.doi.org/10.1093/nar/gkn223
