Image:Fig1 MSM.jpg
From Proteopedia
No higher resolution available.
Fig1_MSM.jpg (575 × 473 pixel, file size: 137 KB, MIME type: image/jpeg)
Sumario
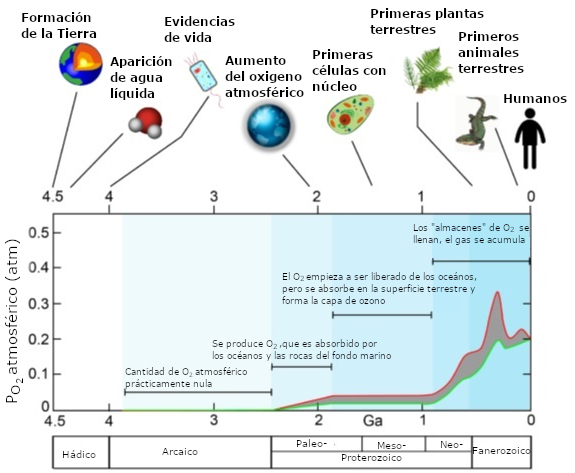
Estimación superior (curva roja) e inferior (curva verde) de la cantidad de oxígeno acumulado en la atmósfera en una escala de tiempo de miles de millones de años (Ga) y acontecimietos relevantes para el desarrollo de la vida en la Tierra. Adaptado de: Lubitz, W.; Chrisina, M.; Cox, N. Water oxidation in photosystem II. Photosynthesis Res. 2019. 142, 105-125
Licensing
Creative Commons Attribution 3.0 License
![]()
File history
Click on a date/time to view the file as it appeared at that time.
| Date/Time | User | Dimensions | File size | Comment | |
|---|---|---|---|---|---|
| (current) | 11:54, 7 February 2022 | María Sánchez Morán (Talk | contribs) | 575×473 | 137 KB | Estimación superior (curva roja) e inferior (curva verde) de la cantidad de oxígeno acumulado en la atmósfera en una escala de tiempo de miles de millones de años (Ga) y acontecimietos relevantes para el desarrollo de la vida en la Tierra. Adaptado de |
- Edit this file using an external application
See the setup instructions for more information.
Links
The following pages link to this file:
Metadata
This file contains additional information, probably added from the digital camera or scanner used to create or digitize it. If the file has been modified from its original state, some details may not fully reflect the modified image.
| Orientation | Normal |
|---|---|
| Horizontal resolution | 96 dpi |
| Vertical resolution | 96 dpi |
| Software used | GIMP 2.10.12 |
| File change date and time | 11:24, 15 January 2022 |
