Image:Omar Saleh LigPlot Figure.png
From Proteopedia
Size of this preview: 452 × 600 pixels
Full resolution (678 × 900 pixel, file size: 165 KB, MIME type: image/png)
Summary
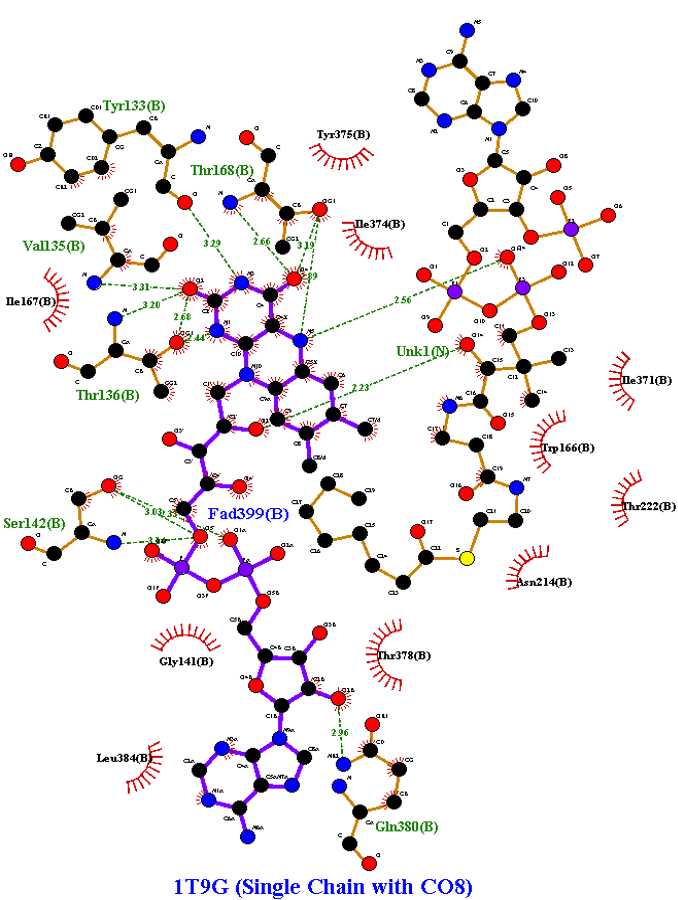
LigPlot+ results of the computerized-specific 1T9G, with hydrogen bonds shown in olive green, hydrophobic interactions shown in brick red, and UNK as CO8.
Licensing
| |
File history
Click on a date/time to view the file as it appeared at that time.
| Date/Time | User | Dimensions | File size | Comment | |
|---|---|---|---|---|---|
| (current) | 22:34, 21 May 2023 | Omar Saleh (Talk | contribs) | 678×900 | 165 KB | LigPlot+ results of the computerized-specific 1T9G, with hydrogen bonds shown in olive green, hydrophobic interactions shown in brick red, and UNK as CO8; clarifies Figure of Jmol models A-C. |
- Edit this file using an external application
See the setup instructions for more information.
Links
The following pages link to this file:
