Ribbon diagram showing fold
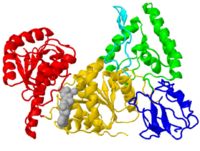
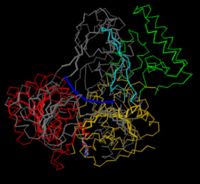
The first view of a protein shown in a publication is often a cartoon of the . The fold of a protein refers to how secondary structure elements are assembled in three dimensions, and it is often shown in a cartoon (Richardson diagram).
Looking at the diagram, and using the view buttons and the buttons to turns things on and off, you can answer questions like:
- Which secondary structures do you see in the different domains?
- Which domains potentially interact with the bound ATP molecule?
- How big is this molecule?
- What shape is this molecule?
- Zooming in using the views provided above, which domains might be involved in binding UvrA?
- Zooming in using the views provided above, which domains might be involved in binding DNA?
- What kinds of beta sheets are found in the different domains (parallel/antiparallel/mixed)?
- What parts of the molecule might be flexible (do you see any potential hinges)?
- In the beta sheets, how are beta strands connected (by which secondary structure element, on which side of the sheet?
- Are the beta sheets flat or twisted?
- What is the central domain (i.e. the one directly connected to everything)?
- How are the other domains connected to the central domain, by one or more connector?
- How many residues in a typical strand or helix (hover over ends to see residue numbers)?
Domains are whatever the authors define them as. In the case of UvrB, we highlighted the parts similar to other helicases in yellow and red, while the green, blue and cyan elements were novel. We did try to separate the protein into parts with separate hydrophobic cores (e.g. ) along sensible boundaries, but there is mostly no experimental evidence. However, the blue domain is a real domain in the sense that it was deleted in a protein variant that retained function (except UvrA-binding, which is through the blue domain). In a different study, the cyan element was deleted, and again, the remainder of the protein folded properly as it still hydrolyzed ATP (but no longer bound tightly to DNA, which is via the cyan hairpin loop).
Surface charges
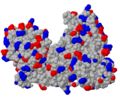
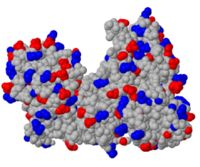
To show where negatively or positively charged molecules are bound, 2D-figures sometimes show surfaces colored by an electrostatic potential calculated from the point charges on Asp, Glu, Arg, Lys and - if the charge state is known - His. The common color scheme is blue for positive and red for negative potential (corresponding nicely to the CPK color scheme with blue nitrogen atoms - carrying a positive formal charge - and red oxygen atoms - carrying a negative formal charge). A quick and simple approximation in Jmol is to show the molecule as spacefill, and . (You could also just color the side chain oxygen and nitrogen atoms, but you then ignore charges of disordered atoms missing in the model but present in the protein.) The UvrB protein shown does not exhibit any obvious regions of positive or negative charges.
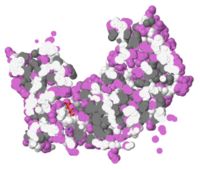
Hydrophobic side chains
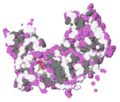
To show on the surface of the protein, we can color the carbons on the side chains of Met, Ile, Leu, Val, Phe, Tyr and Trp gray while all other side chain atoms are the color orchid and the backbone is white (the OH group of Tyr is also shown in purple.
Looking at the diagram, and using the view buttons and the buttons to turns things on and off, you can answer questions like:
- Comparing hydrophobic and hydrophilic side chains, which tend to be on the inside and which on the outside?
- Are the hydrophilic side chains clumped or distributed?
- Are the hydrophobic side chains clumped or distributed?
- Is there one hydrophobic core or multiple?
- How are domains related to hydrophobic cores (you might have to go back to the first figure)?
- Does domain 2 behave differently than the others (it is the most disordered domain, is missing several sidechains and its connectivity was updated in later models where the domain was more ordered, e.g. PDBID 1t5l and 2nmv.
- Where are the OH-groups of tyrosines (shown in orchid)?
- What would happen if we place this molecule into a nonpolar solvent such as cyclohexane?
If we want to, we can color the sulfur atoms of Cys and Met in a different color like darkgreen. One exposed hydrophobic side chain of known function is tyrosine 11, which stacks with the adenine ring of bound ATP (shown as ball-and-stick in color).
This might look like there are a lot hydrophobic side chain on the surface, but if you look inside the protein, it is much more hydrophobic in the hydrophobic cores of the various domains.
Degree of conservation
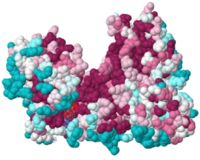
To show evolutionary , we use data from ConSurf (scene on the left).
Looking at the 3D scene, and using the view buttons and the buttons to turns things on and off, you can answer questions like:
- Which surface areas are most likely to be binding surfaces or have other functional significance (you know where ATP binds, so you can test whether surface conservation points to the binding site)?
- Is the inside or the outside of a protein more conserved (use the "Shave away" button from the previous section)?
- Are hydrophilic or hydrophobic side chains more conserved?
- Which domains might be part of a large family of related structures, and which might be more unique?
- Are the cysteine residues conserved in this protein, which does not form disulfide bonds (use the command "display CYS" in jmol after you open the jmol console by right clicking on the 3D viewer)?
The original figures of the primary citation used a trick to see better into the active site between domains 1a and 3: domain 3 was rotated outwards to open up the view. You can use the control below to achieve a similar effect:
Backbone trace and Superpositions
Superpositions of multiple structures is used to show similarity in their folding. It is very difficult to make a clear picture of two entire proteins on top of each other, and the traditional way of decluttering is to use a . This is also a great type of figure if you want to measure distances between alpha carbons, or investigate the overall structure in other ways by clicking on residues.
The following radio buttons allow you to explore the overall structure by clicking on one atom or on a pair of atoms (the last two will change the structure itself, not only how it is represented):
Some choices need the Jmol console, which will open somewhere automatically.
See if you can answer the following questions:
- What are the residues in domain 1 near the ATP ligand? Label them.
- ATP is bound through a conserved structural element called the P-loop, which contain "GKT" as a sequence motif. Using the "show sequence" radio button, figure out the residue numbers of this motif.
- What are the dimensions of domain 3 (first, center on an atom in the middle of domain 3 and zoom in. Then, do some distance measurements)?
- Use the Mg-ion as a marker to show the tunnel formed by domain 1b (green) and the beta hairpin structure (cyan).
- Make a new connection between any two atoms. If you don't like the new bond, click the two atoms again to remove it.
To superimpose UvrB with the related helicase NS3 from the hepatitic C virus, you have to find pairs of corresponding residues (e.g. K45 of UvrB and K210 from NS3 are equivalent residues of the P-loop) and minimize the distance between pairs. The resulting shows that while some domains (which?) are similar, others are unique to one or the other.
This superposition is complicated. Try hiding some of the elements to see clearer, and open a popup 3D browser to view a larger version. Also, rotate the molecules a bit to see them from different angles. You can use the wobble button at the bottom of the page as well. In the original publication [1](Fig. 4), the figure is shown in stereo for better viewing, and domain 2 is omitted. In the Jmol browser used here, you can turn on stereo as well. This is best done in the pop-up window using the right-click menu, but depending on your eyes, you might need stereo glasses to experience the effect.

