FirstGlance/Visualizing Conservation
From Proteopedia
FirstGlance in Jmol is the easiest-to-use tool for visualizing, understanding, and sharing protein molecular structure. It offers guided exploration with extensive explanations and examples, yet provides ample power for advanced users. With a few mouse clicks, any molecular scene can be saved as an animation (GIF file) ready to drop into a Powerpoint Slide -- see examples below, and tinyurl.com/movingmolecules.
Among many conveniences offered by FirstGlance, it is easy to see the levels of evolutionary conservation determined by the ConSurf Server for amino acids of special interest. Below is an overview with some illustrated examples. Here are instructions for running the ConSurf Server on proteins of interest. Note that you cannot use FirstGlance to visualize results from the ConSurf Database, ConSurfDB. Unfortunately, the interface to FirstGlance was removed from ConSurfDB PDB files in 2022.
There are 2 ways to analyzie your own ConSurf Server results in FirstGlance:
- 1. At the ConSurf Server results page, open High Resolution Figures and PDB Files, and then click Download ConSurf PDB File for FirstGlance in Jmol. Now, you can upload the downloaded file to FirstGlance. By downloading the PDB file, you will have it after the results disappear from the ConSurf Server.
- 2. At the ConSurf results page, Right click the link Download ConSurf PDB File for FirstGlance in Jmol, and select Copy Link. Then, at FirstGlance, click enter a molecule's URL, paste the address into the slot, and click Submit.
Initial View of Conservation
Initially, FirstGlance colors each amino acid in the protein chain processed by ConSurf according to its level of conservation. This gives you an overview, enabling you to see patches of highly conserved residues (functional sites).
Biological Unit 1 Shown Initially
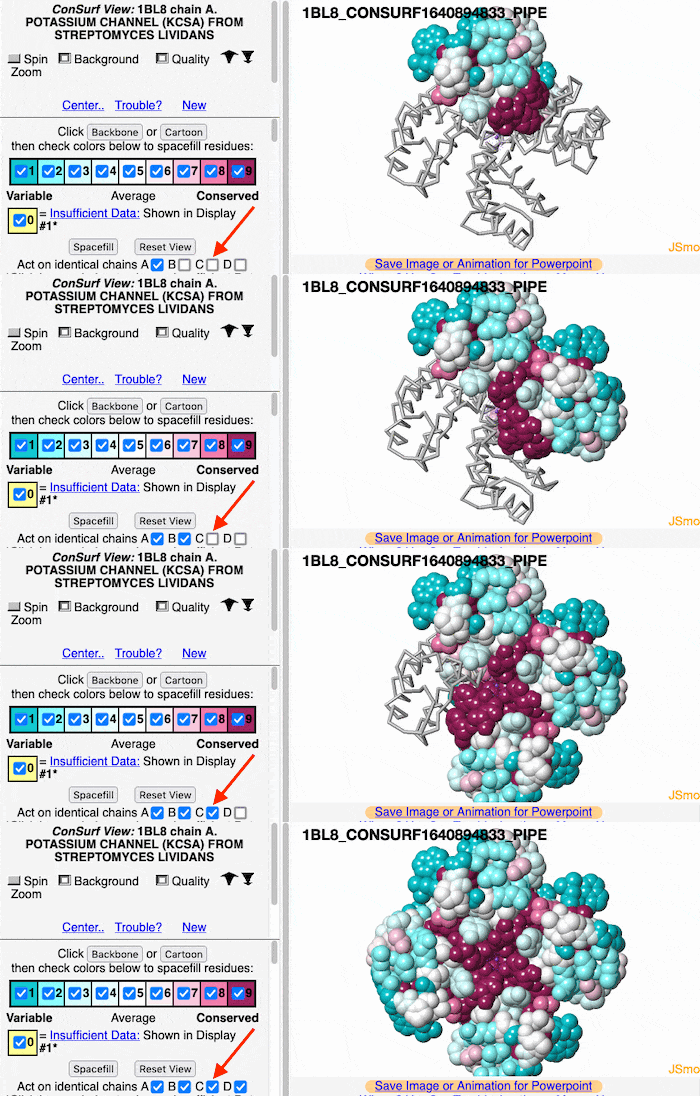
FirstGlance automatically constructs and displays Biological Unit 1 (believed to be the major functional quaternary assembly) in its initial view. If the protein chain processed by ConSurf is duplicated, you will have the option of applying conservation colors to all chains that are identical in sequence with the ConSurf-processed chain (see snapshot in next section).
To find out whether any other biological units that are specified, and to display each, or to display the asymmetric unit, you will need to go to the FirstGlance Control Panel: see instructions below.
Multiple Chains
If the model has more than one copy of the chain processed by ConSurf, you can apply conservation colors to all of those sequence-identical chains. Here, for example, is a potassium channel homotetramer:
Optimization
Before going further, it is good to decide whether the results are satisfactory, or need optimization. Lets consider 7bak, a drug-target protease of SARS-CoV-2 (see Coronavirus Proteases).
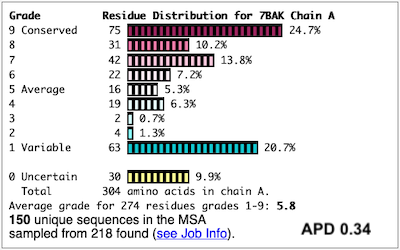
A ConSurf run with all default settings left 10% of the residues with insufficient data[1] (yellow color), and the diversity in the multiple sequence alignment (MSA) was too low (average pairwise distance 0.34), leaving conservation grades 2 and 3 almost unoccupied. These inadequacies are highlighted by a distribution report displayed by FirstGlance.
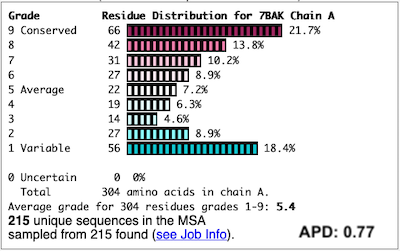
To improve the results, a new ConSurf job for 7bak was submitted, increasing the HMMER search iterations from 1 to 2, and increasing the maximum number of sequences in the MSA from 150 to 300. The results were satisfactory, with a more reasonable APD of 0.77.
For more examples, see Interpreting ConSurf Results
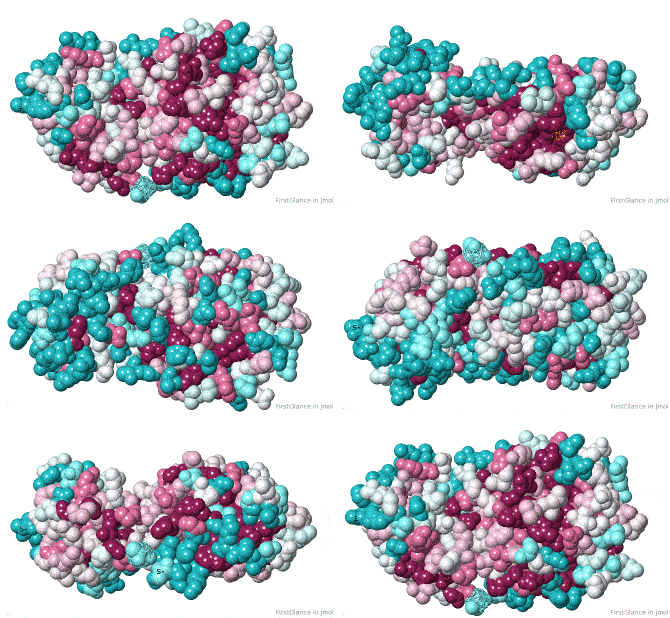
Initial View: Conserved Face
The initial view utilizes the "ConSurf Control Panel" (labeled ConSurf View). One side of the molecule is more conserved than the opposite side. The more conserved face includes the catalytic site.
Animations for Slides
It is very easy to save any molecular view in FirstGlance as a GIF animation, ready to drop into a slide in Powerpoint (or other presentation software): Instructions. The animation above is one example. More examples: tinyurl.com/MovingMolecules.
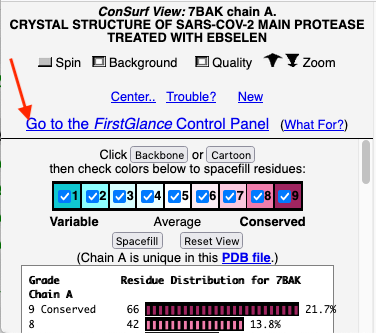
Go To The FirstGlance Control Panel
|
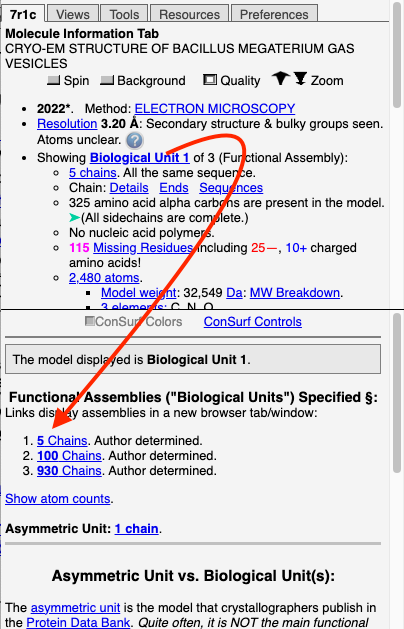
To further explore the pattern of conservation, we need to change from the ConSurf View to the FirstGlance Control Panel. Click the link indicated by the red arrow in the above snapshot. The FirstGlance Control Panel has 5 tabs (see snapshot at right). The Molecule Information Tab and the Views tab each provide a wealth of information. Notice that you can move freely back and forth between the ConSurf Controls and the FirstGlance Controls using the link ConSurf Controls in the middle of the left side of FirstGlance. Biological UnitsNote the link Showing Biological Unit 1 in the Molecule Information Tab. Clicking this will show a report in the lower left panel of FirstGlance listing any other biological units that are specified. Links are provided to display any of these, or the asymmetric unit, in a separate section. Example: Bacterial gas vesicle 7r1c. |
Conservation of Salt Bridges
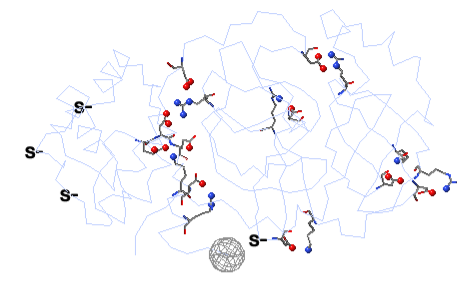
Show Salt Bridges
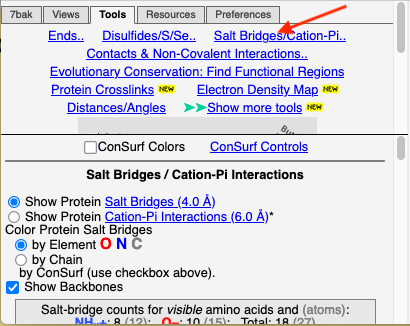
Click the Tools tab, and there click Salt Bridges/Cation-Pi.. (red arrow below). This shows all the protein-protein salt bridges in the model where Negative (Asp, Glu) charges are within 4.0 Å of Positive (Arg, Lys) charges.
Color by Conservation
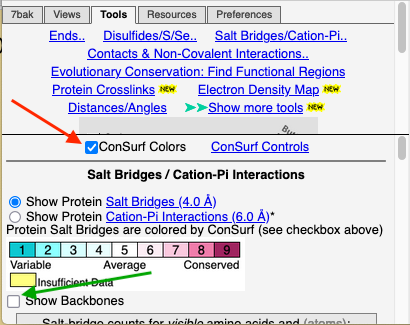
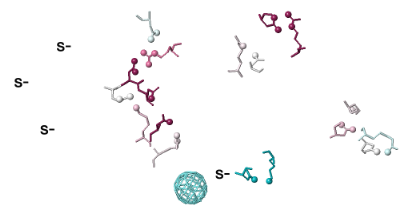
To see how well the salt-bridged residues are conserved, click the checkbox ConSurf Colors (red arrow below). Declutter the view by unchecking Show Backbones (green arrow below). Scroll down in the lower left panel and click List All to get a spreadsheet-ready list that includes conservation values for each pair of salt-bridged atoms.
Label All Residues
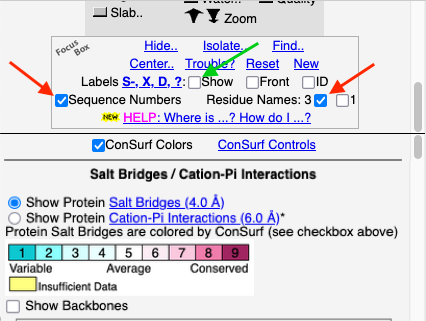
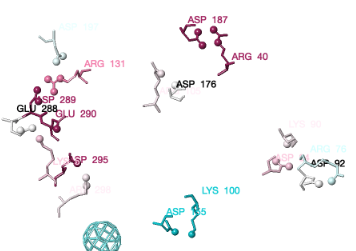
You can identify residues by touching them (hold the mouse still, and a tooltip appears), or clicking on them. But it may be more convenient to label all salt bridge residues. Scroll down to the Focus Box in the upper left panel. Here you can check Sequence Numbers and Residue Names (red arrows below). If you wish, you can hide the S- labels that designate incomplete sidechains by unchecking the checkbox Labels, Show (green arrow below).
Conclusions for Salt Bridges
Conservation of residues engaged in salt bridges varies over the entire range of conservation grades from 1 to 9. In some bridges, both residues are highly conserved (grades 8 or 9). In others, one partner is highly conserved, while the other is not. In some pairs, neither partner is conserved.
Conservation of Cation-Pi Interactions
This can be done the same way as Salt Bridges. Simply click the radio button to switch from Salt Bridges to Cation-Pi interactions (see snapshots above).
Conservation of Residues Binding Ligand/Substrate
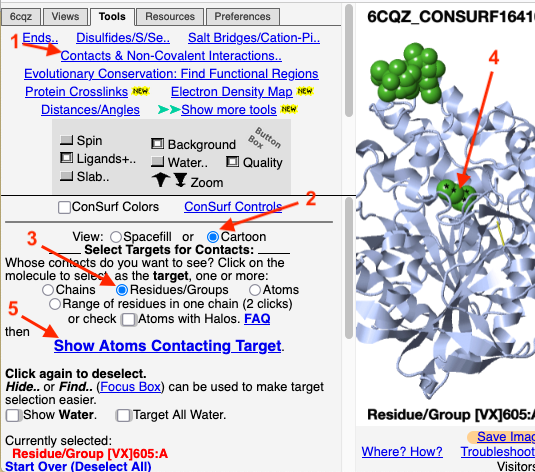
FirstGlance provides an easy and powerful tool to explore residues contacting any specified portion of the model. For this example, we'll use acetylcholinesterase complexed to the inhibitor VX, crystal structure 6cqz.
We'll look at the conservation of the residues that contact the ligand/inhibitor VX. From the ConSurf View, go to the FirstGlance Control Panel.
|
The atoms that are likely bonded, covalently or non-covalently, to the target ligand VX are now shown as balls.
|
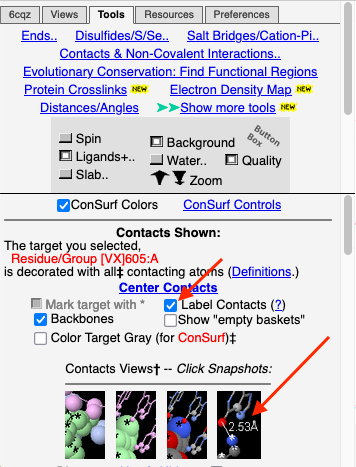
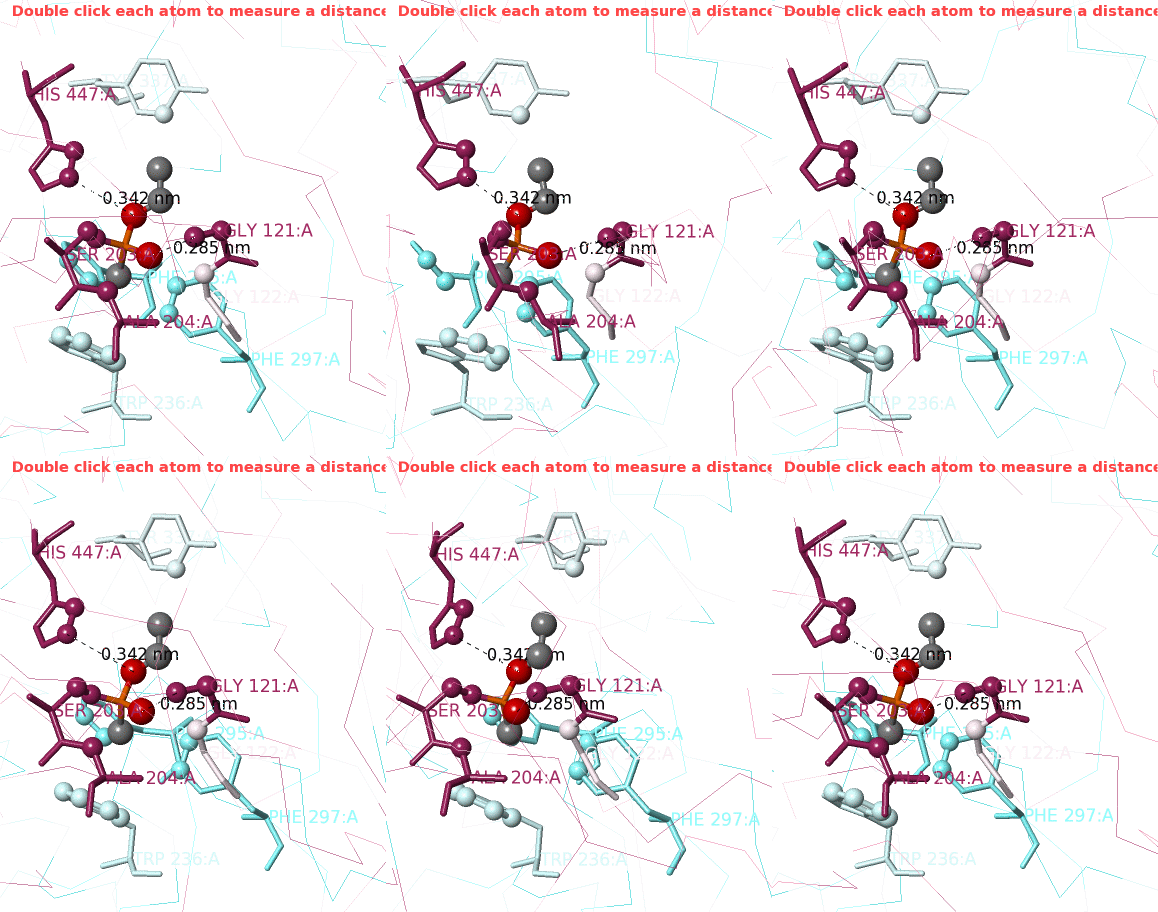
1. Click Center Contacts and zoom in (mouse wheel). 2. Click the Label Contacts checkbox. 3. There are 4 "snapshots" at the lower left. Clicking each one renders the contacts differently. The most detailed view is given after you click the 4th snapshot. 4. Uncheck Color Target Gray. VX is now colored by chemical element: C O P 5. Uncheck Backbones to declutter the view. 6. Toggle the Background (in the gray Button Box) as needed to see light or dark labels. 7. Scroll down in the Contacts Shown (lower left) panel to see the color key and the paragraph marked † which explains this view. 8. ConSurf Colors is checked by default, but you can uncheck it to color by chemical element. |
Conclusions: Ser203 is covalently bonded to the phosphorus in VX. His447 (3.4 Å) and Gly121 (2.9 Å) are likely hydrogen-bonded to oxygens in VX.
For instructions on how to measure a distance, click Distances/Angles in the Tools tab. You can later return to the Contacts Shown controls by clicking Return to Contacts which will appear in the middle left next to ConSurf Colors.
In human acetylcholinesterase, the catalytic triad residues[2] are Ser203, His447, and Glu334. We can see that the first two are highly conserved, but what about Glu334 which is not contacting VX?
Conservation of Specified Residues
This section explains how to visualize the conservation of any residues that you specify. The snapshot below is a continuation of the previous section, but this procedure works for any specified residues in any ConSurf result.
Glu334 in 6CQZ
In the previous section, we remained curious about the conservation level of Glu334 in 6CQZ, a member of the catalytic triad of human acetylcholinesterase.
|
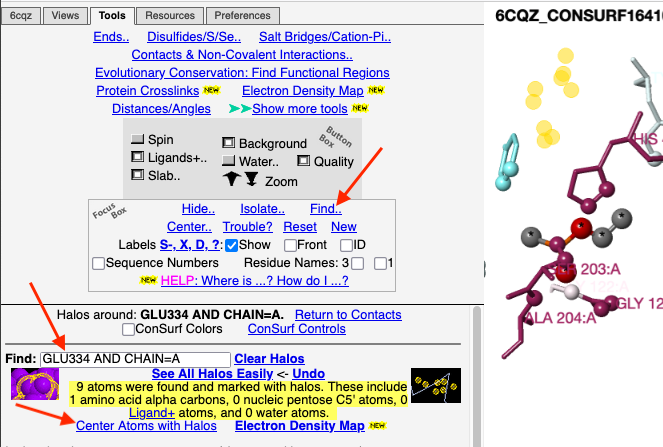
1. Click Find.. (in the Focus Box). 2. In the Find slot, type
3. Click Center Atoms with Halos. |
|
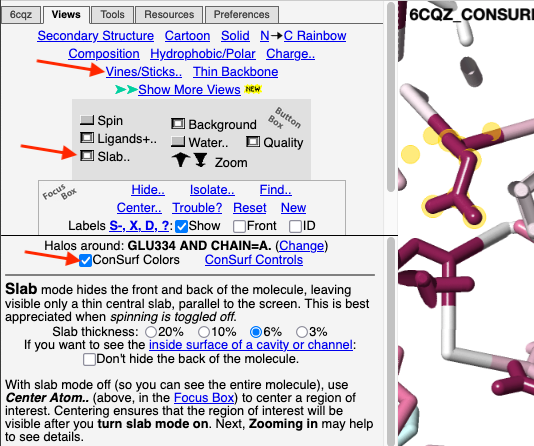
4. Click the Views tab at the very top. 5. Click Vines/Sticks. 6. Depress the Slab button to declutter the view. (Adjust the slab thickness if needed.) 7. Check ConSurf Colors. Conclusion: Now we can see that Glu334, the residue with yellow halos, is highly conserved. To confirm its identity, touch it to see a tooltip, or click on it. Or you can label all residues as shown in the example above. |
All Tryptophans
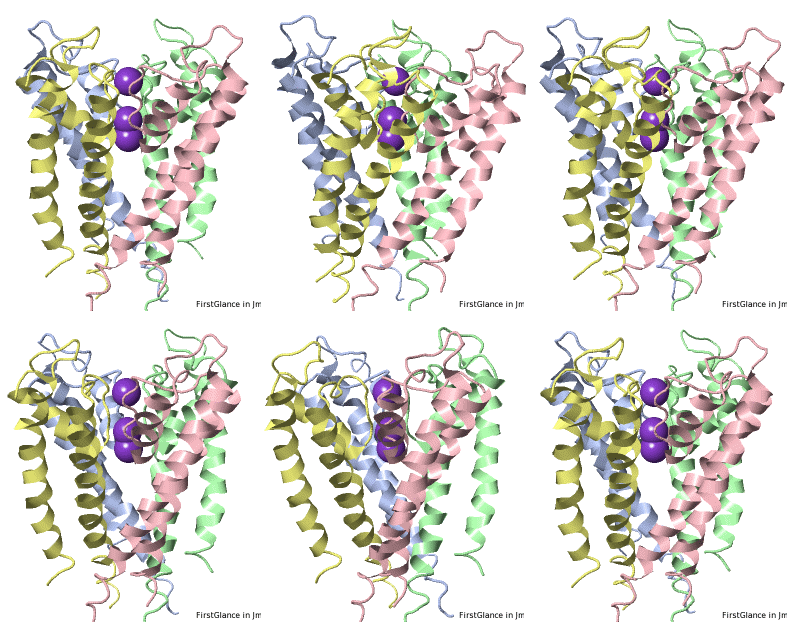
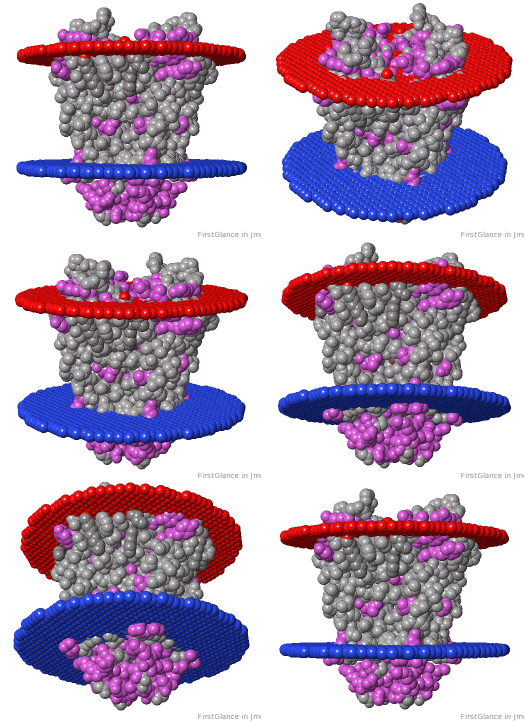
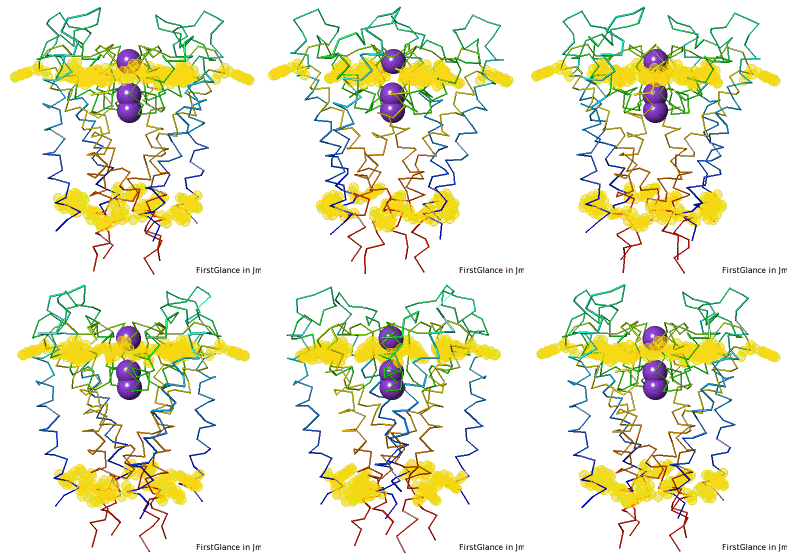
Tryptophans are known to orient at, and parallel to, the apolar-polar interface in transmembrane channels such as the potassium channel[3][4][5]. Let's see which Trps are conserved in the potassium channel 1bl8 (a Nobel Prize-winning structure!).
Potassium Channel 1bl8 | ||
4 chains with K+.
| Hydrophobic, Polar.
| Trp positions.
|
* FirstGlance uses the Orientations of Proteins in Membranes (OPM) Server at the University of Michigan.
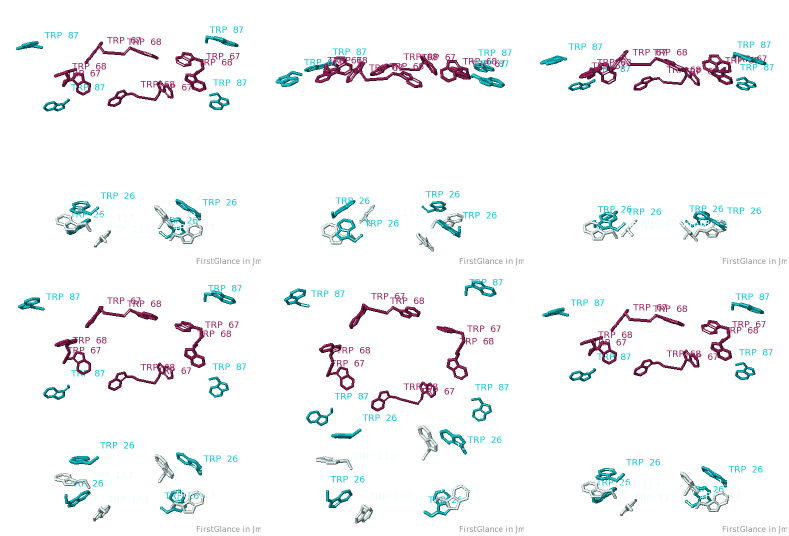
Conservation of Trp
|
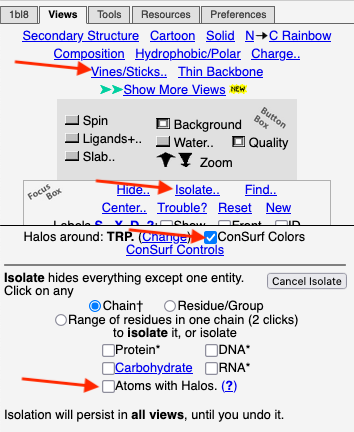
After entering "Trp" in the Find slot: 1. Views tab: Vines/Sticks. 2. Check ConSurf Colors. 3. Isolate: Atoms with Halos. 4. Find: Clear Halos. |
Conclusions
Only Trp67 and Trp68, near the extracellular opening of the channel, are highly conserved.
Conservation of Protein Crosslinks
FirstGlance automatically detects covalent protein crosslinks of six types, plus disulfide bonds. FirstGlance has tools that make it easy to examine each such crosslink in detail. If the PDB file has been processed by ConSurf, it is easy to see the levels of conservation of the crosslinked residues.
Isopeptide-Linked Ubiquitin Trimer
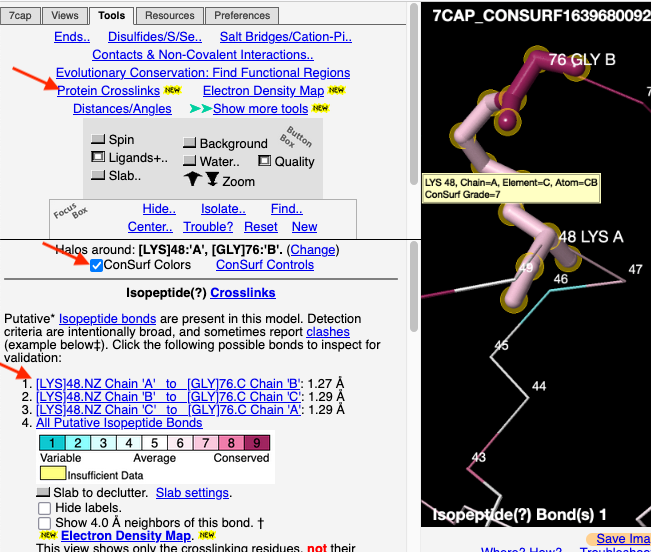
An example is isopeptide bond-linked chains of ubiquitin. 7cap is an isopeptide-linked trimer of ubiquitin. The carboxy-terminal Gly76 forms an isopeptide bond with Lys48. Here is one ConSurf result (300 sequences in the multiple sequence alignment (MSA), sampled from 10,122 unique similar sequences. The MSA had an average pairwise distance of 1.15):
First, follow the instructions for getting a list of the isopeptide crosslinks.
Then, proceed as follows:
|
1. Click on one of the crosslink bonds (bottom red arrow). 2. Check the box to apply ConSurf Colors (middle red arrow). 3. Touch a residue (hold the mouse still) to pop up a tooltip reporting its ConSurf conservation Grade, as shown in the yellow box on Lys48.
|
Other Crosslink Examples
Other examples of covalent protein crosslinks colored by evolutionary conservation are:
See Also
- ConSurf/Index: List of Proteopedia pages about ConSurf.
- FirstGlance/Index: List of Proteopedia pages about FirstGlance in Jmol.
References
- ↑ When the confidence interval for a conservation value of an amino acid is too large, ConSurf reports "insufficient data" (uncertainty: yellow color). See Position Specific Quality and Confidence Interval in the ConSurf documentation.
- ↑ Cheung J, Gary EN, Shiomi K, Rosenberry TL. Structures of human acetylcholinesterase bound to dihydrotanshinone I and territrem B show peripheral site flexibility. ACS Med Chem Lett. 2013 Sep 23;4(11):1091-6. doi: 10.1021/ml400304w. eCollection , 2013 Nov 14. PMID:24900610 doi:http://dx.doi.org/10.1021/ml400304w
- ↑ Sun H, Greathouse DV, Andersen OS, Koeppe RE 2nd. The preference of tryptophan for membrane interfaces: insights from N-methylation of tryptophans in gramicidin channels. J Biol Chem. 2008 Aug 8;283(32):22233-43. doi: 10.1074/jbc.M802074200. Epub 2008 , Jun 11. PMID:18550546 doi:http://dx.doi.org/10.1074/jbc.M802074200
- ↑ de Jesus AJ, Allen TW. The role of tryptophan side chains in membrane protein anchoring and hydrophobic mismatch. Biochim Biophys Acta. 2013 Feb;1828(2):864-76. doi: 10.1016/j.bbamem.2012.09.009., Epub 2012 Sep 16. PMID:22989724 doi:http://dx.doi.org/10.1016/j.bbamem.2012.09.009
- ↑ Tryptophan, an Amino-Acid Endowed with Unique Properties and Its Many Roles in Membrane Proteins, Sonia Khemaissa, Sandrine Sagan, and Astrid Walrant. Crystals, 2021, 11(9), 1032; doi.org/10.3390/cryst11091032.
